[7.15] God Forgive
Oh no, what’s that…
———————————————————————————————————————
I decided I would share the results from last week’s election poll since they were actually very similar between US and non-US respondents.
US: 71% Biden/15% Trump/14% Other
World: 74% Biden/14% Trump/12% Other
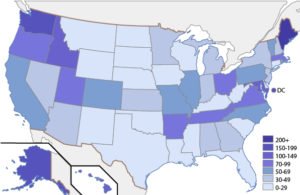
Below is a map representing site visitors per million population for the last 6 months in each US state, which may or may not explain anything about the results… The top 5 states being Maine, Alaska, Washington, Idaho and Maryland. I found this to be more interesting than just looking at the raw numbers. I think I’ll make one for worldwide, though that will take longer.

I enjoyed reading the comments last week, though I must agree with the sentiment expressed by some: I’m done with politics for now, at least until the next election…
7.15 Transcript
A: This way to the library.


Looks like my estimation was actually pretty good. Biden will probably not get more than 60% of the vote in the general election, which means readers of the comic voted for him at least 10 percentage points more than the nation as a whole, and probably closer to 20 or (unlkely) even 30 percentage points.
I actually thought Biden votes would be over 80%, but I also hadn’t thought there would be so many “other” votes. Either a lot of people who actually don’t vote said “other,” or a surprisingly large percentage of this comic’s readership votes third-party, which is fascinating in itself, if so.
I’d love to take a more detailed look, after the election, about how the numbers compare, but looking at other comments, I get the distinct impression nobody really cares to hear it at this point. So I’ll keep the rest of my thoughts to myself unless someone expresses interest.
A’s probably seen that dozens of times, but it seems to have struck a nail with Kiro. Don’t worry, though, He’s already forgiven you – that’s why you’re here now, and there’s hope for the first time. It might not seem like something to be thankful for, but the right road isn’t always the easiest one.
It’s both scary and sad to know that a lot of people died here before. Let’s hope our collection of unlikely heroes can get to the bottom of this and set things right.
I wonder what creates the geographical unevenness of the readership, it will be very interesting to see the world map… wait, no, that is probably less interesting. For the world map I expect pretty much all online entertainment (with a couple exceptions) to show a very similar map (except for China). I think such maps will basically show how much the population of each country is leisurely browsing the internet, with a multiplier of their ability to read English. I don’t think that can explain the US map though.
OMG I thought the map was about the elections poll results, then I read that it’s about site visitors 🙂
It’s interesting that the election poll has pretty much the same percentages between USA and World
I’ve seen some maps of webcomic readership before. I think the reason it tends to be unevenly distributed is, new readers tend to hear about comics from friends, family, and coworkers, leading to large clusters of readers within well-connected economic regions. I’m sure there’s more to it than that, though. I got here from an advertisement on another webcomic, after all.
Well this map is “per million”. IMHO the map of raw # of readers would be more interesting.
That would look more like a map of the general population. California has the highest raw number but only because it’s massive. In terms of visitors per million, CA falls to the lower half of the list.
Hm. Most popular in the northern, frigid climes…obviously the readers identify with an environment where there’s seals and grizzly bears and stray earth spirits.
In my opinion, the relatively high amount of people reading this in Alaska is interesting. Is this because this playing in Alaska has better SEO there? Or is there some other reason. (Or is it just an artifact of displaying it per million and the relatively low population of Alaska)